⚠️ This blog post was created with the help of AI tools. Yes, I used a bit of magic from language models to organize my thoughts and automate the boring parts, but the geeky fun and the 🤖 in C# are 100% mine.
The Aspire Demo We Didn’t Get to Show Live: Watching an Agent Harness Work
We ran out of time during Session 4 of MafClaw to show the Aspire dashboard demo. And this is one of those demos that really benefits from seeing it, not just hearing “yes, we have observability.”
So here is the walkthrough we didn’t get to do live: take a small C# agent, let Microsoft Agent Framework’s Harness call a tool, and follow that work through traces, structured logs, and metrics in Aspire.
No finance application to understand first. No AppHost. No Docker requirement. Just a console sample and the standalone dashboard.
Start with one question and one tool
Sample 12, 12-observability-aspire, asks a deliberately simple question:
What is this workshop lesson about?
The agent has one ordinary C# function, get_lesson_topic. It returns a synthetic workshop topic. The interesting part is not the answer; it is what happens between the question and the answer.
The model requests the tool, the Harness executes it and sends its result back, and the model produces the final response. We make one RunAsync call. We do not write that model/tool loop ourselves.
This is a new variant, not a replacement for the earlier observability samples:
| Sample | What it teaches |
|---|---|
| 10 | Instrument an ordinary C# request and tool with spans and a counter. |
| 11 | Observe the real MAF/Harness agent, model, and tool spans in the console. |
| 12 | Export the generic agent’s telemetry and explore it in Aspire. |
The complete finance application is still the final example, after these concepts have been introduced on their own.
Two terminals, then dotnet run
You need .NET 10, the Aspire CLI, and the MafClaw source. This walkthrough uses Aspire CLI 13.5.1. The normal sample uses your configured Microsoft Foundry model, so complete the shared setup once from the repository root:
.\tools\configure-user-secrets.ps1az login --output none
If your Session 4 model settings are already configured, do not set them again just for this sample. It shares the existing settings store. Live model inference can incur charges. In the first terminal:
aspire dashboard run
Open the login URL printed by the CLI and keep its browser token private. The default browser endpoint is http://localhost:18888; the OTLP/HTTP receiver is on http://localhost:4318. They are different ports for different jobs.
In the second terminal, from the public repository root:
cd .\session-04\samples\12-observability-aspiredotnet run
That’s the demo command. No --live, no save/resume arguments, and no dashboard configuration file to write.
Select mafclaw-sample12 in the dashboard. The console prints the trace ID so you can find the exact run instead of guessing which request to open.
About the screenshots: these were captured after the session, not during the broadcast. They use explicitly scripted model responses (
--fixture) to keep the screenshots reproducible and free of live deployment identifiers. The Harness, C# tool execution, OpenTelemetry export, and Aspire records are real. The short timings are not live model latency or a performance benchmark.
1. Traces: who did what?
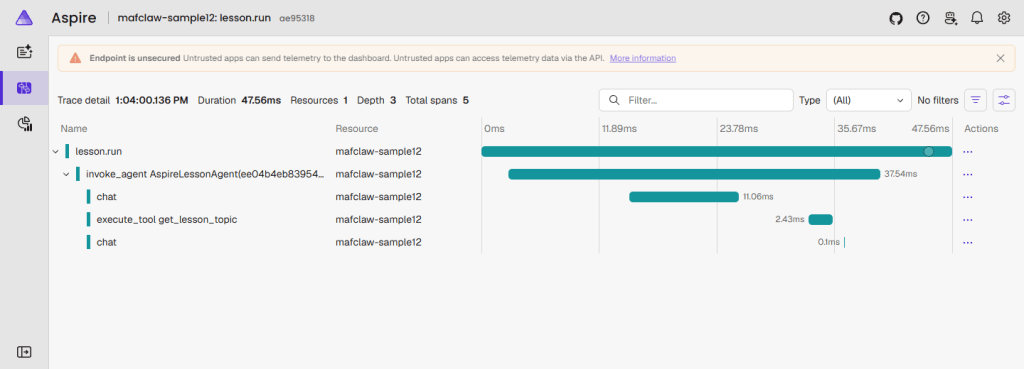
Post-session fixture capture: five real spans, including the model/tool/model sequence inside the Harness invocation.
Expand the trace and read it from the outside in:
lesson.runis the sample’s root operation.invoke_agentis the MAF agent invocation.- The first
chatis the model turn that asks to use the tool. execute_tool get_lesson_topicis the actual C# tool execution.- The second
chatprocesses the returned result.
That is the part I wanted to pause on during the stream. The final answer doesn’t tell us whether a function actually ran. The trace gives us the execution path and the parent/child relationships.
In a live run, this also helps separate model latency from tool latency. A fixture still proves orchestration, but its near-instant model turns cannot tell us how fast the configured model will be.
2. Structured logs: give a message its context
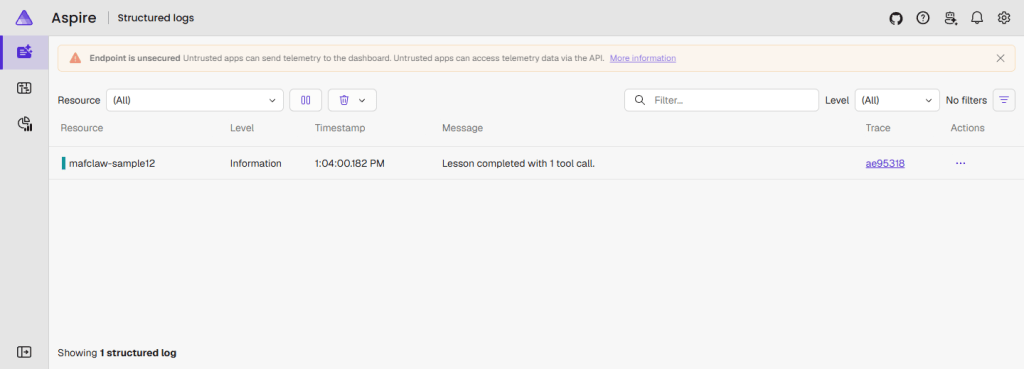
The completion log links back to the same trace shown above.
The application emits one intentionally boring message:
logger.LogInformation("Lesson completed with {ToolCalls} tool call.", toolCalls);
Because that log is written while lesson.run is active, it carries the trace and span identifiers. Click the trace link in Aspire and you return to the work that produced the message.
This is much more useful than a disconnected “done!” line. The log answers “what did the application report?” and the trace lets us investigate “what happened around it?”
Also notice what the message does not contain: the user prompt, the model’s answer, or the tool payload.
3. Metrics: count the behavior, not the prose
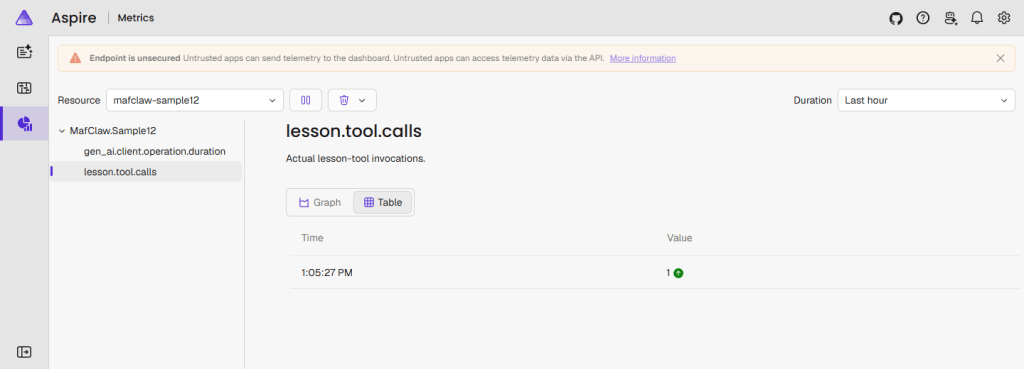
The counter is incremented inside the real C# tool. Aspire’s Table view shows a value of 1 for this run.
The counter is small enough to explain without leaving the file:
var toolCounter = meter.CreateCounter<long>( "lesson.tool.calls", description: "Actual lesson-tool invocations.");
Inside GetLessonTopic, we call:
toolCounter.Add(1);
This is a measurement of an invocation, not the model claiming that it called a tool. Each run of this short console sample creates a fresh in-process counter; it is not a durable total across process restarts.
Aspire also lists SDK instruments such as operation duration and token usage when available. Missing token data does not mean zero tokens. Scripted inference is not evidence of real model usage or cost.
Where the instrumentation comes from
The integration is visible in Program.cs, rather than hidden behind the final application’s factory. These two excerpts show the important boundaries:
using var observedModel = model.AsBuilder() .UseOpenTelemetry( sourceName: sourceName, configure: telemetry => telemetry.EnableSensitiveData = false) .Build();
Microsoft.Extensions.AI observes individual model calls. We use that client to construct the Harness with AsHarnessAgent, then instrument the outer agent invocation:
var agent = harness.AsBuilder() .UseOpenTelemetry( sourceName, telemetry => telemetry.EnableSensitiveData = false) .Build();
The Harness’s automatic telemetry wrapper is disabled in this sample so the explicit agent wrapper is the one we teach, not a duplicate. Tool invocation instrumentation comes from the SDK. OpenTelemetry then subscribes to those sources and exports the data:
using var traces = Sdk.CreateTracerProviderBuilder() .SetResourceBuilder(resource) .AddSource(sourceName, "Microsoft.Extensions.AI") .AddOtlpExporter(options => ConfigureExport(options, "traces")) .Build();
The metric and log providers use the same service name. The exporter helper sends HTTP/protobuf to /v1/traces, /v1/metrics, and /v1/logs on the local receiver.
So the responsibilities are separate: the Harness orchestrates, the SDK instruments, OpenTelemetry exports, and Aspire displays. Starting the dashboard alone does not instrument an application.
Two details that matter in a short demo
Flush before the process exits. A console program can finish before batched telemetry has been sent. The sample explicitly flushes traces and metrics and disposes the log provider. It also observes exporter failures. A successful answer followed by a failed export is not reported as an observability success.
ASPIRE EXPORT PASS means the run and flushes completed without a reported exporter failure. It is still worth opening Aspire and checking the retained records, as we did here.
Keep content capture off, but don’t call that complete redaction. Both wrappers set EnableSensitiveData = false. Operational metadata, including model identifiers or server addresses in live runs, can still appear. Use synthetic questions, keep the dashboard local, and inspect screenshots before sharing them.
The screenshots came from a separate loopback-only dashboard with anonymous access for the capture. That is why Aspire’s unsecured-endpoint warning is visible. The normal aspire dashboard run command above keeps its default browser-token protection; do not expose an anonymous dashboard to a network.
If you see an answer but no telemetry
First, make sure the dashboard was started before the sample. Then check that the exporter points at 4318, not the UI’s 18888. A stale OTEL_EXPORTER_OTLP_ENDPOINT environment variable can override the sample’s default; clear it or set it to the matching loopback HTTP base address.
The standalone dashboard stores telemetry in memory. Stopping the console doesn’t remove the exported run, but restarting the dashboard does. It is a telemetry viewer here, not an AppHost managing the console process.
For an offline rehearsal, dotnet run -- --fixture uses scripted inference while keeping the real tool and telemetry pipeline. It still needs a running dashboard or collector. That switch is for reproducible checks; the normal teaching flow remains dotnet run.
The demo’s real takeaway
An agent’s answer is the beginning of the investigation, not the whole story. With this small sample we can see which component called the tool, how the model turns fit together, and whether the log and counter agree with the trace.
We didn’t get to show that live, but now you can run it at your own pace: start the dashboard, run the sample, and follow one request all the way through.
The series materials are in the MafClaw repository.
See the Sample 12 source and walkthrough
and the Aspire standalone dashboard documentation
for the complete setup and troubleshooting details.
Happy coding!
Greetings
El Bruno
More posts in my blog ElBruno.com.
More info in https://beacons.ai/elbruno


Leave a comment