Hello !
A few days ago in my podcast review of Connect 2016, I talked about Visual Studio 2017 new features. One of the features that have caught my attention these days is the ability to analyze the performance of VS2017 IDE when we are using extensions, the use of panels and the Solutions load time.
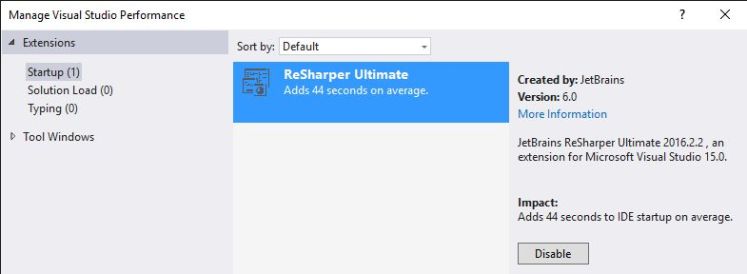
For example, after a while using VS2017, when I open it I find the following message related to ReSharper.

I can see the “extra” time that ReSharper adds to the Visual Studio 2017 load process. At the beginning, it was more than a minute, but after a couple of adjustments I managed to lower that time about 20 seconds.
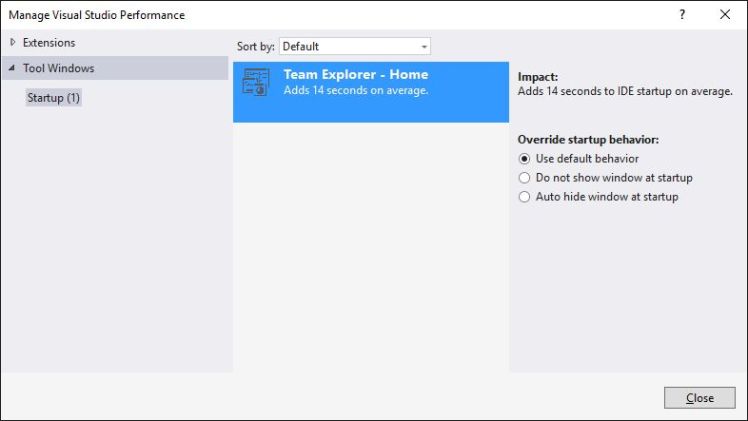
Another interesting feature is Visual Studio does the same analysis for internal tools like IDE panels such as Team Explorer. In this case, it is detected that it impacts the initial load of Visual Studio because when connecting and refreshing Visual Studio Team Services, it seems that the times are not optimal.
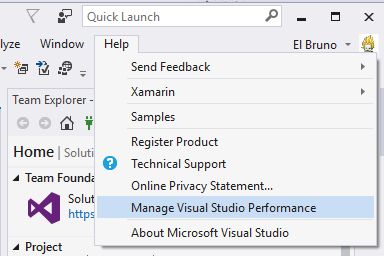
And, what should be the 1st paragraph of this post. The way to access this functionality is through the menu “Help // Manage Visual Studio Performance”
Greetings @ Toronto
El Bruno
Refernces
- Visual Studio Blog, Visual Studio 2017 Release Candidate
- El Bruno, Visual Studio 2017

That yellow bar is easily the most annoying feature ever in Visual Studio. It’s worse than Clippit. They desperately need to include a “Why don’t you go ahead and assume I’m not a moron? – stop giving me unsolicited advice.” setting in Options to disable this pointless annoyance. The worst part is it gives the same inane “help” again and again automagically every time you start Visual Studio, with no option to say “don’t bother me again”. That’s simply a pain in the neck that developers don’t appreciate or need. I can only imagine the Visual Studio devs or UX people have no social skills whatsoever.
LikeLike
Hi Rachel,
I get your point, however “worst than Clippit?”, that’s too much!
I’ve searched and could not find a similar request, so I created one >> https://visualstudio.uservoice.com/forums/121579-visual-studio-ide/suggestions/19454506-add-and-option-to-enable-disable-the-automatic-e
Thanks for sharing.
Regards
LikeLike